Table of Contents
A helpdesk ticket that only says “VPN is slow” or “Zoom keeps freezing” rarely points to one obvious cause. Bandwidth could be maxed out. A single host could be saturating the uplink. DNS could be failing intermittently. Something unexpected could be talking outbound. Without traffic data, every guess costs another site visit or another hour of remote troubleshooting.
Small networks usually have the building blocks already: a managed switch, a business firewall, and a wireless controller. What they lack is a deliberate choice about how much of that traffic to watch, and at what depth. Three common approaches cover almost every practical case. They answer different questions, cost different amounts of storage and staff time, and fail in different ways when you stretch them too far.
Start with the Question, not the Tool
Before enabling NetFlow or buying a TAP, write down what you actually need to know when something breaks.
- Is the WAN link full, or is the problem somewhere else?
- Which internal host or application is responsible?
- Is the traffic legitimate, misconfigured, or hostile?
- Do you need evidence of a specific handshake or payload?
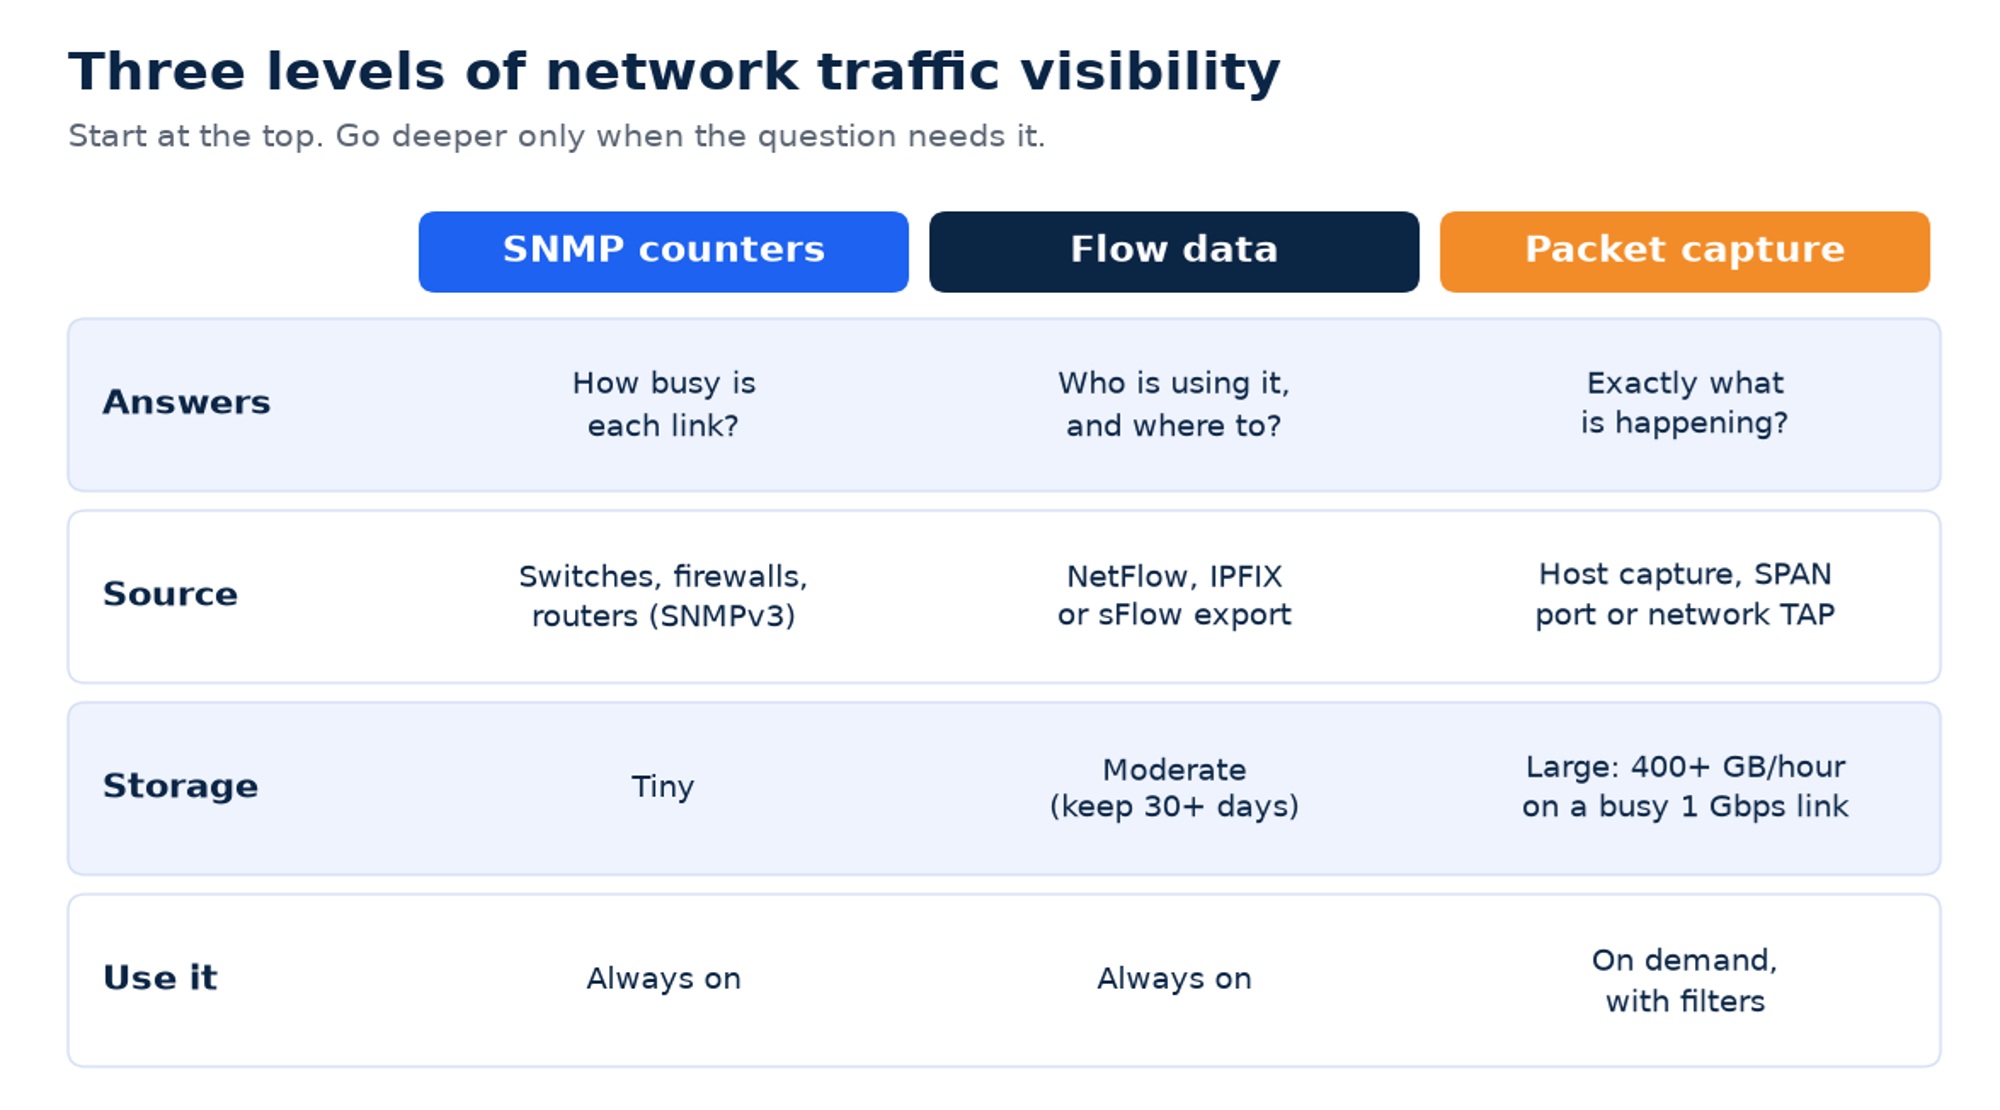
If the answer is mainly the first item, interface counters are enough. If you need host and application attribution, you need flow data. If you need to prove what happened inside a conversation, you need packet capture. Mixing those goals into one “monitoring project” is how teams overspend on capture gear they never open, or underinvest in flow collectors and then still cannot explain who filled the pipe.
Three Levels of Visibility on a Small Network
Interface Counters: Cheap baseline, Limited attribution
Managed switches, routers, and firewalls already keep octet and error counters per interface. Poll them with SNMP (or the vendor’s API) and you get utilisation over time, error rates, and discards.
That answers capacity questions quickly. You can see whether the ISP handoff peaked at 95% during the complaint window, whether a particular switch uplink is chronically busy, and whether a port is accumulating CRC errors that usually mean a bad patch cable or a duplex mismatch.
A few operational details matter more than the choice of graphing tool:
SNMPv3 with auth and privacy should be the default wherever the device supports it. Community-string SNMPv2c still appears on older gear; if you must use it, change the string, restrict source IPs to the collector, and treat the community as a credential.
Use 64-bit high-capacity counters (ifHCInOctets / ifHCOutOctets). On a busy gigabit link, the older 32-bit counters wrap in well under a minute. With a five-minute poll interval, wrapped counters produce nonsense graphs that look like sudden drops or spikes.
Alert on sustained high utilisation and on rising errors, not only on absolute throughput. A quiet link with growing discards is often a worse problem than a busy but clean link.
LibreNMS, Zabbix, Cacti, and similar open collectors handle this well. Commercial suites such as PRTG can be faster to stand up if staff time is the scarce resource. Either way, SNMP alone will never tell you which laptop or which SaaS backup job is responsible for the load.
Flow Records: Who talked to whom
Flow export (NetFlow, IPFIX, or sFlow) turns conversations into compact records: source and destination addresses, ports, protocol, byte and packet counts, and timing. The firewall or router sends those records to a collector that can rank top talkers, map destinations, and highlight unusual patterns.
This is the layer most small offices skip, and it is the one that closes the majority of “who is using the bandwidth” tickets. Useful signals show up quickly once you keep thirty days of history:
A workstation pushing large volumes to an unfamiliar external IP overnight deserves a same-day look. Clients that suddenly prefer public DNS resolvers over your internal servers can indicate malware, a bad DHCP option, or a user-installed “privacy” tool. Outbound SMB (TCP 445) or RDP (TCP 3389) from the LAN to the public internet almost always means a misconfiguration or a compromise attempt. A single NVR or nightly backup that saturates the uplink every afternoon explains a surprising number of intermittent SaaS complaints.
NetFlow v9 and IPFIX are template-based and, unless you enable sampling, generally record every flow the exporter sees. sFlow samples packets and is lighter on switch ASICs, at the cost of less precision on short or small flows. For a site with a few dozen users, either approach is workable. Collectors such as ntopng, Elastiflow, or the flow modules inside PRTG and Zabbix are enough to start.
Confirm export support on the firewall before budgeting for anything else. Many business-class appliances can emit flows, but the feature is frequently disabled or tied to a licence tier. Enabling it and pointing it at an internal collector is usually a one-afternoon job.
Packet Capture: Surgical detail, not a permanent archive
When the question is “what exactly failed inside this session,” counters and flows stop being enough. A TLS handshake that stalls, TCP retransmissions on a lossy path, or an application that hangs after a specific response all require packets.
Full-rate capture on a busy 1 Gbps link can generate hundreds of gigabytes per hour, so treat capture as a targeted tool. Filter early. Capture for minutes, not days, unless you have a dedicated forensic pipeline and retention policy.
Practical collection paths on a small network:
On the affected host, tcpdump or Wireshark is often the fastest start. A short filter such as port 53 or a specific peer IP keeps the file small enough to email or attach to a ticket.
A SPAN or mirror port on a managed switch copies a port or VLAN to an analysis NIC. Watch the destination port speed: if mirrored traffic exceeds that port’s capacity, the switch drops frames without a loud alarm.
A hardware network TAP copies traffic without depending on switch mirroring and is preferable for longer or evidentiary captures.
A short list of Wireshark display filters covers a large share of day-to-day cases: tcp.analysis.retransmission for loss, dns.flags.rcode != 0 for failed lookups, and tcp.flags.syn == 1 && tcp.flags.ack == 0 to see who is initiating connections.
Do not leave continuous full capture running “just in case.” The storage bill and the privacy exposure grow quickly, and most incidents are still solved faster from flow history plus a short targeted pcap.
A Workable Stack for a small business
For a typical office of tens of users, a durable pattern looks like this:
- SNMP on every switch, firewall, and wireless controller, with alerts for links above roughly 80% utilisation for more than fifteen minutes and for climbing interface errors.
- Flow export from the firewall (and from core switches if they support it) into a collector retained for at least thirty days.
- Packet capture kept as an on-demand skill, with known SPAN ports or TAPs documented so the next incident does not start with a scavenger hunt for cables.
Then establish a baseline. Note what a normal midweek day looks like: peak WAN utilisation, the usual top talkers, typical DNS query volume, and whether overnight backups are expected. Anomalies are only obvious against that backdrop.
If building and babysitting collectors is more than the internal team can sustain, ongoing network traffic monitoring is something many managed IT providers already operate as part of day-to-day support. The first move is the same either way: turn on the telemetry your existing gear can already emit, store enough history to look backward after a ticket lands, and escalate to packets only when the question truly requires them.
ABOUT THE AUTHOR

IPwithease is aimed at sharing knowledge across varied domains like Network, Security, Virtualization, Software, Wireless, etc.