Table of Contents
What is Syslog?
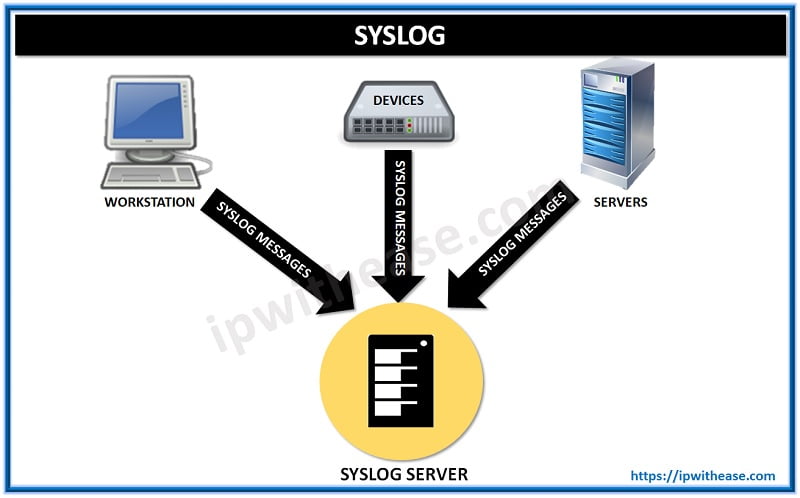
Syslog is a method to collect messages from devices to a server running a syslog daemon. Logging to a central syslog server helps in aggregation of logs and alerts. Cisco devices can send their log messages to a Unix-style SYSLOG service. A SYSLOG service simply accepts messages, and stores them in files or prints them according to a simple configuration file. This form of logging is the best available for Cisco devices because it can provide protected long-term storage for logs. This is useful both in routine troubleshooting and in incident handling.

Configure Logging in the Cisco IOS
When configuring logging, the most important command to know is the logging command, used when in Global Configuration Mode. Here’s an example of this command and its options.
router (config) # logging?
Hostname or A.B.C.D      IP address of the logging host
buffered                            Set buffered logging parameters
buginf                               Enable buginf logging for debugging
cns-events                        Set CNS Event logging level
console                             Set console logging parameters
count                                Count every log message and timestamp last occurrence
exception                          Limit size of exception flush output
facility                              Facility parameter for syslog messages
history                              Configure syslog history table
host                                  Set syslog server IP address and parameters
monitor                            Set terminal line (monitor) logging parameters
on                                     Enable logging to all supported destinations
origin-id                           Add origin ID to syslog messages
rate-limit                          Set messages per second limit
reload                               Set reload logging level
server-arp                         Enable sending ARP requests for syslog servers when first configured
source-interface               Specify interface for source address in logging transactions
trap                                   Set syslog server logging level
userinfo                            Enable logging of user info on privileged mode enabling
Logging Levels of Syslog Server
There are eight different logging levels of syslog server:
0—emergencies

1—alerts

2—critical

3—errors

4—warnings

5—notification

6—informational

7—debugging
Router Configuration for Syslog
Router#
Router #config terminal
Enter configuration commands, one per line. End with CNTL/Z.
Router(config)#logging 192.168.0.30
Router(config)#service timestamps debug datetime localtime show-timezone msec
Router (config)#service timestamps log datetime localtime show-timezone msec
Router (config)#logging facility local3
Router (config)#logging trap warning
Router (config)#end
Router #show logging
Syslog logging: enabled (0 messages dropped, 0 flushes, 0 overruns)
Console logging: level debugging, 79 messages logged
Monitor logging: level debugging, 0 messages logged
Buffer logging: disabled
Trap logging: level warnings, 80 message lines logged
Logging to 192.168.0.30, 57 message lines logged
View the status of logging and the logging itself
To view the status of your logging as well as the local buffered log, use the show logging command. Here’s an example:
router# show logging
Syslog logging: enabled (0 messages dropped, 394 messages rate-limited,91 flushes, 0 overruns, xml disabled, filtering disabled)
Console logging: level debugging, 2766982 messages logged, xml disabled,filtering disabled
Monitor logging: level debugging, 12370 messages logged, xml disabled,filtering disabled
Buffer logging: level debugging, 2754146 messages logged, xml disabled,filtering disabled
Logging Exception size (4096 bytes)
Count and timestamp logging messages: disabled
Trap logging: level debugging, 3420603 message lines logged
Logging to 10.1.1.1, 3420603 message lines logged, xml disabled,filtering disabled
Log Buffer (10000000 bytes): i96
Feb 7 13:34:00.065 CST: %LINK-3-UPDOWN: Interface Serial1/1:22, changed state to up
Feb 7 13:34:00.069 CST: %DIALER-6-BIND: Interface Se1/1:22 bound to profile Di96
Note that this router has enabled syslog logging and is sending it to host 10.1.1.1. In addition, console logging is at the debugging level, and the setting for local buffered logging is 10,000,000 bytes.
Look out for these common logging errors
Logging can be frustrating at times. To help prevent some of that frustration, let’s look at three common errors.
1. Not setting the terminal to monitor logging
If you Telnet into a router and can’t see some of the logging you’re expecting, check to see if you’ve set your terminal to monitor the logging. You can enable this with the terminal monitor command. To disable it, use the terminal no monitor command.
To determine whether you’ve enabled monitoring, use the show terminal command, and look for the following:
Capabilities: Receives Logging Output
If you see this, you’re monitoring logging output. If it returns None for capabilities, then the monitoring is off.
2. Using the incorrect logging level
If you can’t see logging output, you should also check whether you’ve set the level correctly. For example, if you’ve set the console logging to emergencies but you’re running debugging, you won’t see any debugging output on the console. To determine the set level, use the show logging command. Keep in mind that you need to set the level to a higher number to see all levels below it. For example, setting logging at debugging shows you every other level.
In addition, make sure you match the type of logging that you want to see with the level you’re configuring. If you configure monitor logging to debug but you’re on the console and you’ve set it to informational, you won’t see the debug output on the console.
3. Displaying the incorrect time and date in logs
You may see log messages that don’t exhibit the correct date and time. There are a variety of options to control the date and time that appear on logging output (either to the screen or to the buffer). To control this, use the following command:
Router(config)# service timestamps debug ?
datetime      Timestamp with date and time
uptime        Timestamp with system uptime
Remember that many problems require some kind of historical log to help find a solution. That’s why it’s important to make sure you’ve properly configured logging so you can use your logs to see the past.
Watch Related Video
ABOUT THE AUTHOR

You can learn more about her on her linkedin profile – Rashmi Bhardwaj


